无编辑摘要 |
无编辑摘要 |
||
| 第103行: | 第103行: | ||
}}</ref> 在[[R (programming language)|R语言]]中实现了这种检验。<ref>{{cite web |title=muStat package (R code) |date=August 23, 2012 |url=https://cran.r-project.org/package=muStat/}}</ref> | }}</ref> 在[[R (programming language)|R语言]]中实现了这种检验。<ref>{{cite web |title=muStat package (R code) |date=August 23, 2012 |url=https://cran.r-project.org/package=muStat/}}</ref> | ||
== 事后分析 == | |||
[[Post-hoc analysis|事后检验]]最早由Schaich和Hamerle(1984年)<ref>Schaich, E. & Hamerle, A. (1984). Verteilungsfreie statistische Prüfverfahren. Berlin: Springer. {{ISBN|3-540-13776-9}}.</ref>以及Conover(1971年,1980年)<ref>Conover, W. J. (1971, 1980). Practical nonparametric statistics. New York: Wiley. {{ISBN|0-471-16851-3}}.</ref>提出,用于决定哪些组别之间的平均排名差异显著。这些程序在Bortz, Lienert和Boehnke(2000年,第275页)的文献中有详细描述。<ref>Bortz, J., Lienert, G. & Boehnke, K. (2000). Verteilungsfreie Methoden in der Biostatistik. Berlin: Springer. {{ISBN|3-540-67590-6}}.</ref> Eisinga, Heskes, Pelzer和Te Grotenhuis(2017年)<ref>{{cite journal | last1 = Eisinga | first1 = R. | last2 = Heskes | first2 = T. | last3 = Pelzer | first3 = B. | last4 = Te Grotenhuis | first4 = M. | year = 2017 | title = Exact [math]p[/math]-values for pairwise comparison of Friedman rank sums, with application to comparing classifiers | doi = 10.1186/s12859-017-1486-2 | journal = BMC Bioinformatics | volume = 18 | issue = 1 | pages = 68 | pmc = 5267387 | pmid=28122501 | url=http://rdcu.be/oOf9 | doi-access = free }}</ref>提供了一种用于弗里德曼排名和的成对比较的精确检验,该检验在[[R (programming language)|R]]语言中得到实现。[[Eisinga c.s. exact test|Eisinga等人的精确检验]]比现有的近似检验有显著改进,特别是当组数([math]k[/math])较多且区块数([math]n[/math])较少时。 | [[Post-hoc analysis|事后检验]]最早由Schaich和Hamerle(1984年)<ref>Schaich, E. & Hamerle, A. (1984). Verteilungsfreie statistische Prüfverfahren. Berlin: Springer. {{ISBN|3-540-13776-9}}.</ref>以及Conover(1971年,1980年)<ref>Conover, W. J. (1971, 1980). Practical nonparametric statistics. New York: Wiley. {{ISBN|0-471-16851-3}}.</ref>提出,用于决定哪些组别之间的平均排名差异显著。这些程序在Bortz, Lienert和Boehnke(2000年,第275页)的文献中有详细描述。<ref>Bortz, J., Lienert, G. & Boehnke, K. (2000). Verteilungsfreie Methoden in der Biostatistik. Berlin: Springer. {{ISBN|3-540-67590-6}}.</ref> Eisinga, Heskes, Pelzer和Te Grotenhuis(2017年)<ref>{{cite journal | last1 = Eisinga | first1 = R. | last2 = Heskes | first2 = T. | last3 = Pelzer | first3 = B. | last4 = Te Grotenhuis | first4 = M. | year = 2017 | title = Exact [math]p[/math]-values for pairwise comparison of Friedman rank sums, with application to comparing classifiers | doi = 10.1186/s12859-017-1486-2 | journal = BMC Bioinformatics | volume = 18 | issue = 1 | pages = 68 | pmc = 5267387 | pmid=28122501 | url=http://rdcu.be/oOf9 | doi-access = free }}</ref>提供了一种用于弗里德曼排名和的成对比较的精确检验,该检验在[[R (programming language)|R]]语言中得到实现。[[Eisinga c.s. exact test|Eisinga等人的精确检验]]比现有的近似检验有显著改进,特别是当组数([math]k[/math])较多且区块数([math]n[/math])较少时。 | ||
| 第142行: | 第141行: | ||
== 引用 == | == 引用 == | ||
{{Reflist}} | {{Reflist}} | ||
{{Navplate AlgorithmNodeList}} | {{Navplate AlgorithmNodeList}} | ||
[[Category:参数检验]] | [[Category:参数检验]] | ||
2024年1月21日 (日) 16:17的版本
 | |
| 节点状态 | 在V1.0.2部署
|
|---|---|
Friedman检验  | |
| 节点开发者 | 决策链算法研发部 (Dev.Team-DPS) |
| 节点英文名 | Friedman Test |
| 功能主类别 | 数据分析 |
| 英文缩写 | FrimTest |
| 功能亚类别 | 参数检验 |
| 节点类型 | 数据挖掘 |
| 开发语言 | R |
| 节点简介 | |
Friedman检验是一种非参数统计方法,用于检验两个或更多相关样本的中位数是否存在显著差异。这对于重复测量设计或匹配的设计非常有用。 用途:用于在重复测量设计或匹配实验设计中比较两个或更多的处理或条件。 参数:选择连续型数值变量和分类分组变量。 | |
| 端口数量与逻辑控制(PC) | |
| Input-入口 | 3个 |
| Output-出口 | 3个 |
| Loop-支持循环 | 是 |
| If/Switch-支持逻辑判断 | 否 |
| 输入输出 | |
| 相关节点 | |
| 上一节点 | 两样本配对T检验 |
| 下一节点 | 秩和检验 |
弗里德曼检验是一种由弗里德曼开发的非参数 统计检验。[1][2][3] 类似于参数 重复测量 方差分析,它被用于检测多次测试尝试中治疗效果的差异。该程序包括对每一行(或区块)进行排名,然后考虑按列排名的值。适用于完全区组设计,因此是德宾检验的一个特殊情况。
经典的使用例子包括:
- [math display="inline"]n[/math]位葡萄酒评委分别评价[math display="inline"]k[/math]种不同的葡萄酒。是否有任何[math display="inline"]k[/math]种葡萄酒被一致性地排名高于或低于其他葡萄酒?
- [math display="inline"]n[/math]位焊工分别使用[math display="inline"]k[/math]种焊接火炬,随后对焊接质量进行评分。是否有任何[math display="inline"]k[/math]种火炬产生一致性更好或更差的焊接?
弗里德曼检验用于一元重复测量方差分析的秩。在使用秩的方面,它与克鲁斯卡尔-沃利斯一元方差分析的秩相似。
弗里德曼检验是一种被许多统计软件包广泛支持的方法。
方法
- 给定数据[math]\{x_{ij}\}_{n\times k}[/math],即一个具有[math]n[/math]行(区块),[math]k[/math]列(处理)的矩阵,每个区块和处理的交叉点有一个观察值,计算每个区块内的排名。如果存在相同值,为每个相同值分配无相同值时应赋予的排名的平均值。用一个新矩阵[math]\{r_{ij}\}_{n \times k}[/math]替换数据,其中条目[math]r_{ij}[/math]是[math]x_{ij}[/math]在区块[math]i[/math]中的排名。
- 找到值[math]\bar{r}_{\cdot j} = \frac{1}{n} \sum_{i=1}^n {r_{ij}}[/math]
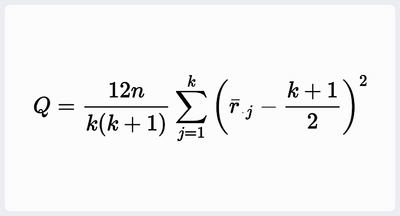
- 检验统计量由[math]Q = \frac{12n}{k(k+1)} \sum_{j=1}^k \left(\bar{r}_{\cdot j}-\frac{k+1}{2}\right)^2[/math]给出。注意,[math display="inline"]Q[/math]的值需要针对数据中的相同值进行调整。[4]
- 最后,当[math display="inline"]n[/math]或[math display="inline"]k[/math]较大(即[math display="inline"]n>15[/math]或[math display="inline"]k> 4[/math])时,[math display="inline"]Q[/math]的概率分布可以近似为卡方分布。在这种情况下,P值由[math]\mathbf{P}(\chi^2_{k-1} \ge Q)[/math]给出。如果[math display="inline"]n[/math]或[math display="inline"]k[/math]较小,卡方的近似变得较差,P值应从专门为弗里德曼检验准备的[math display="inline"]Q[/math]表中获取。如果P值显著,则应进行适当的事后多重比较测试。
相关测试
事后分析
事后检验最早由Schaich和Hamerle(1984年)[7]以及Conover(1971年,1980年)[8]提出,用于决定哪些组别之间的平均排名差异显著。这些程序在Bortz, Lienert和Boehnke(2000年,第275页)的文献中有详细描述。[9] Eisinga, Heskes, Pelzer和Te Grotenhuis(2017年)[10]提供了一种用于弗里德曼排名和的成对比较的精确检验,该检验在R语言中得到实现。Eisinga等人的精确检验比现有的近似检验有显著改进,特别是当组数([math]k[/math])较多且区块数([math]n[/math])较少时。
并非所有统计软件包都支持弗里德曼检验的事后分析,但存在用户贡献的代码提供这些功能(例如在SPSS中,[11]以及在R中。[12])。此外,在R中还有一个专门的软件包,包含用于弗里德曼事后分析的多种非参数方法。[13]
节点使用的R语言示例代码
Friedman检验
friedman.test(y, ...)
节点使用指南
- 检测多个相关样本群组的总体中位数是否存在差异
- 重复测量ANOVA的非参数替代
- 当数据无法满足ANOVA的正态分布假设或方差齐性假设时,Friedman检验特别有用。
方法选择
- 长表输入:需要输入分组和ID变量,每个变量会做一次检验,通常重复数据。
- 宽表输入:每个变量都代表一个组,不需要分组和ID变量,此方法不支持筛选阈值。
参数配置
- 检验变量:选择连续型数值变量,长表输入是每个变量做一次检验,宽表输入是一个变量代表一个分组
- 分组变量: 选择分类型分组,长表输入时需要选择。
- ID变量: 选择分类型ID变量,标识每个观察值所属的块。在重复测量设计中,每个单位将被视为一个块,长表输入时需要选择。
- 方法选择: 长表输入,宽表输入
- 筛选阈值:选择需要的P值阈值,节点会自动将满足阈值的变量筛选出,数据集也会同步筛选出满足的变量。
- 此算法兼容空值
注意事项
- 当选择长表输入的分组变量和ID变量时,每个ID重复数据的分组需要相等,不能有缺失
- 两种方法是通过两个不同纬度来检验重复数据
引用
- ↑ Friedman, Milton (December 1937). "The use of ranks to avoid the assumption of normality implicit in the analysis of variance". Journal of the American Statistical Association. 32 (200): 675–701. doi:10.1080/01621459.1937.10503522. JSTOR 2279372.
- ↑ Friedman, Milton (March 1939). "A correction: The use of ranks to avoid the assumption of normality implicit in the analysis of variance". Journal of the American Statistical Association. 34 (205): 109. doi:10.1080/01621459.1939.10502372. JSTOR 2279169.
- ↑ Friedman, Milton (March 1940). "A comparison of alternative tests of significance for the problem of m rankings". The Annals of Mathematical Statistics. 11 (1): 86–92. doi:10.1214/aoms/1177731944. JSTOR 2235971.
- ↑ "FRIEDMAN TEST in NIST Dataplot". August 20, 2018.
- ↑ Wittkowski, Knut M. (1988). "Friedman-Type statistics and consistent multiple comparisons for unbalanced designs with missing data". Journal of the American Statistical Association. 83 (404): 1163–1170. CiteSeerX 10.1.1.533.1948. doi:10.1080/01621459.1988.10478715. JSTOR 2290150.
- ↑ "muStat package (R code)". August 23, 2012.
- ↑ Schaich, E. & Hamerle, A. (1984). Verteilungsfreie statistische Prüfverfahren. Berlin: Springer. ISBN 3-540-13776-9.
- ↑ Conover, W. J. (1971, 1980). Practical nonparametric statistics. New York: Wiley. ISBN 0-471-16851-3.
- ↑ Bortz, J., Lienert, G. & Boehnke, K. (2000). Verteilungsfreie Methoden in der Biostatistik. Berlin: Springer. ISBN 3-540-67590-6.
- ↑ Eisinga, R.; Heskes, T.; Pelzer, B.; Te Grotenhuis, M. (2017). "Exact [math]p[/math]-values for pairwise comparison of Friedman rank sums, with application to comparing classifiers". BMC Bioinformatics. 18 (1): 68. doi:10.1186/s12859-017-1486-2. PMC 5267387. PMID 28122501.
- ↑ "Post-hoc comparisons for Friedman test". Archived from the original on 2012-11-03. Retrieved 2010-02-22.
- ↑ "Post hoc analysis for Friedman's Test (R code)". February 22, 2010.
- ↑ "PMCMRplus: Calculate Pairwise Multiple Comparisons of Mean Rank Sums Extended". 17 August 2022.
{{cite web}}: Missing or empty|url=(help)
查找其他类别的节点,请参考以下列表